PaReSoGo at a Glance
- Created by Olga Zelinska and Joshua K. Dubrow, Institute of Philosophy and Sociology, Polish Academy of Sciences
- The data were funded by the National Science Centre, Poland Project “Political Voice and Economic Inequality across Nations and Time” (2016/23/B/HS6/03916)
- The dataset Party Representation of Social Groups (PaReSoGo) spans 25 Countries, 2002 – 2016
- PaReSoGo is archived in Polskie Archiwum Danych Społecznych (PADS), the Polish Social Data Archive.
- Citation: Zelinska, Olga; Dubrow, Joshua K.: Party Representation of Social Groups (PaReSoGo) [data]. Institute of Philosophy and Sociology of the Polish Academy of Sciences [producer], Warsaw, 2021. PADS21317. Polish Social Data Archive [distributor], Repozytorium Danych Społecznych [publisher], 2021. https://doi.org/10.18150/NPXPAT, V1
- The data are described in a Party Politics research note: Zelinska, Olga, and Joshua K. Dubrow. “PaReSoGo: Dataset on party representation of social groups for 25 countries, 2002–2016.” Party Politics (2021).
Why PaReSoGo – Party Representation of Social Groups?
Parties and parliamentarians are charged with the responsibility to express and translate the voice of the masses in the legislature. A classic concern is the extent to which political parties who attained seats in parliament represent the masses; a smaller current in the literature is about the party representation of particular social groups.
Social scientists have devised various ways to measure representation gaps across nations and time (see the MARPOR Party-Voter Dataset), but rarely do they account for particular social groups.
To address research questions about how well social groups are represented in parliament across nations and time, we created and are in the process of archiving the dataset, “Party Representation of Social Groups” (PaReSoGo) – that contains a simple and replicable measure of the party representation of social groups per country and year from high quality publicly available survey and administrative data.
How did we measure the Party Representation of Social Groups?
Our country-year measure is based on the idea of issue congruence measures that match distributions. For survey data, we use the European Social Survey (ESS), 2002 – 2016, that contains items on sociodemographics, social attitudes, and retrospective vote choice, i.e. the party that the respondents said they voted for in the last general election.
POLINQ and Aggregation of Survey and Administrative Data
Following the research conducted by the grant on aggregation of survey data to the country-year level, discussed in the grant’s international conference, “Politics and Inequality across Nations and Time: Theoretical and Empirical Approaches,” held at IFiS PAN, December 12 – 14, 2018 in Warsaw, Poland, we aggregated the ESS items to the country and year level. We match the distribution of social groups’ party choices to a distribution of the percentage of parliamentarians in each party that were elected to parliament, as provided by ParlGov.
The Dissimilarity Index
In our data, this match of distributions is made via the Dissimilarity Index (DI). To calculate the party representation with a DI we took a sum of absolute values of the share of seats a given party received in the elections and subtracted the share of ESS respondents who claim that they voted for this party, and divided by two. Here, the DI is a measure of distance in party representation between gender, age, education, intersectional, and attitudinal groups’ retrospective party vote choices and the distribution of parliamentarians in parties. In the PaReSoGo DI, the higher the value, the greater the distance between what social groups want and what parties there are in parliament.
Table 1 illustrates the logic of calculations using Poland 2015 example for young adults.

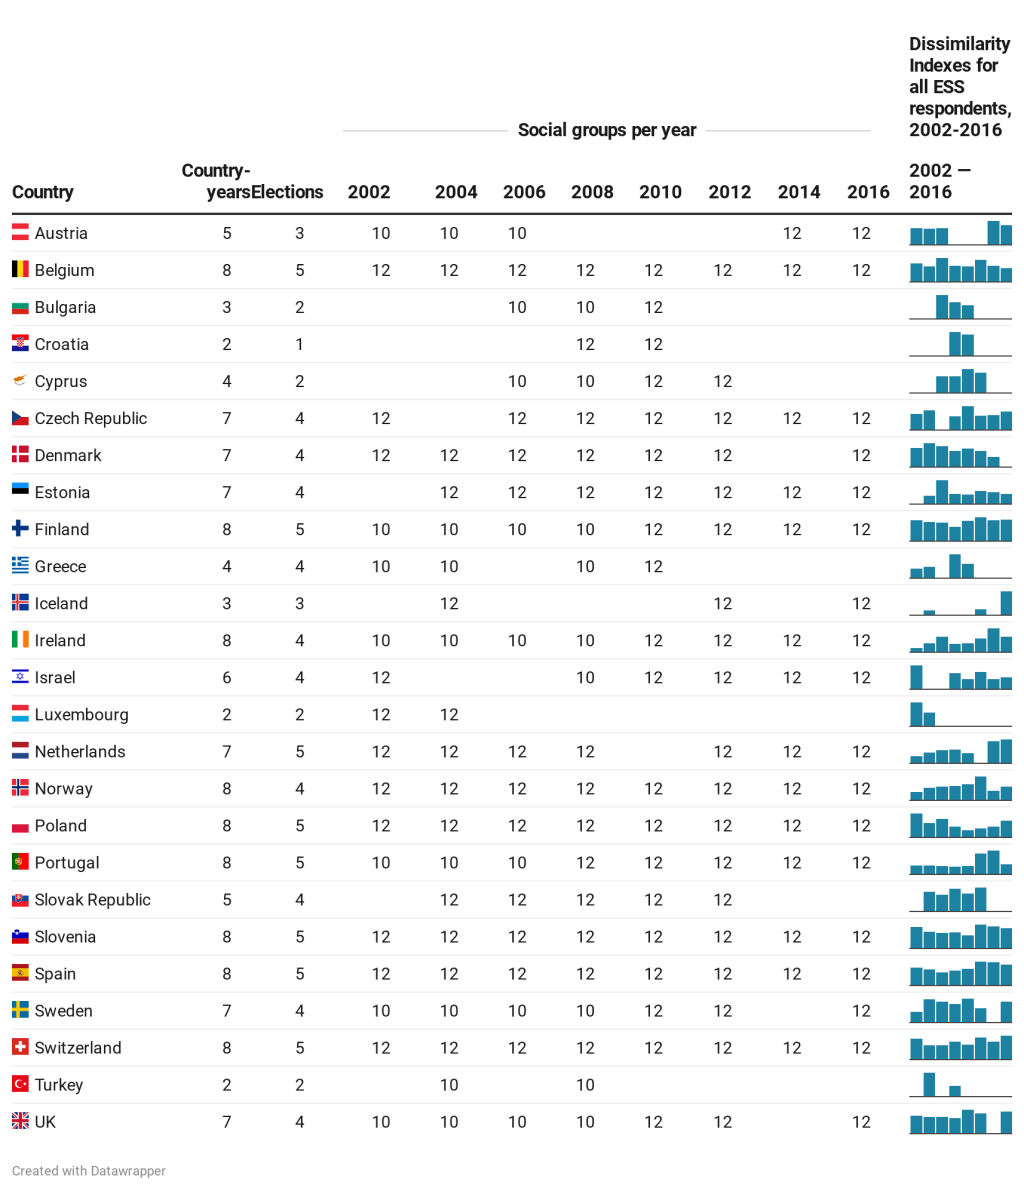
PaReSoGo contains 150 country years, which cover eight ESS rounds (2002-2016) and 95 national elections (1999-2016) across 25 countries.
Table 2 illustrates the data basics. The minimum country-years that cover the same election is one; the maximum is three. For each country-year we calculated the DI for all ESS respondents and twelve social groups of gender, age, and education; intersectional groups based on gender and age; and attitudinal groups for and against immigration. Due to data availability, not all countries are available in all years, and not all groups are available in all country-years.

We presented the data idea in the conference, Building Multi-Source Databases for Comparative Analyses, in December 2019 in Warsaw, Poland and in our 2021 research note in Party Politics.
